Image Details
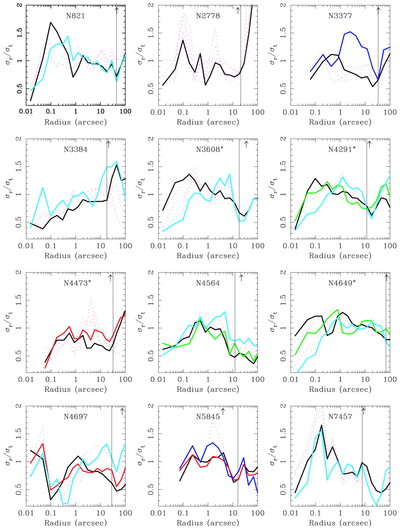
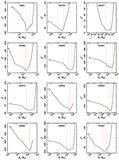
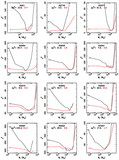
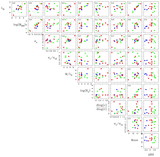
Caption: Fig. 10.
Shape of the velocity dispersion tensor for all 12 galaxies, plotted as a function of radius. The solid lines are at those position angles for which we have kinematic data. The dotted lines are those for which we do not have data but result from the maximum entropy solution for the best‐fit model. The colors represent different position angles. The black line is along the major axis, and the light blue line is near the pole. Other colors are intermediate axes. The vertical solid line is the radial extent of the ground‐based data, and the arrow is at the half‐light radius. An asterisk denotes whether the galaxy is a core galaxy.
Other Images in This Article
Show More
Copyright and Terms & Conditions
© 2003. The American Astronomical Society. All rights reserved. Printed in U.S.A.