Image Details
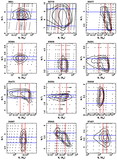
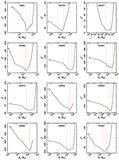
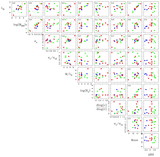
Caption: Fig. 13.
Ratio of the radial to the θ velocity dispersion for all 12 galaxies plotted as a function of radius along the equator for the best‐fit model (solid line). The dotted line is at ﹩\sigma _{r}/ \sigma _{\theta }=1﹩, which is the result along the major axis for a two‐integral model. The galaxies show a range of profiles with no obvious radial trends. The vertical solid line is the radial extent of the ground‐based data; results beyond that radius are not meaningful. An asterisk denotes whether the galaxy is a core galaxy.
Other Images in This Article
Show More
Copyright and Terms & Conditions
© 2003. The American Astronomical Society. All rights reserved. Printed in U.S.A.
Copyright ©
2025 Astronomy Image Explorer. All Rights Reserved.