Image Details
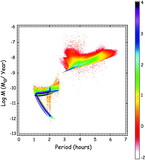
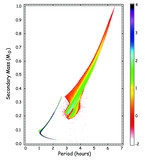
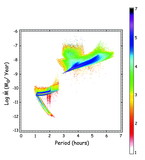
Caption: Fig. 13.
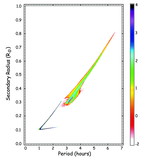
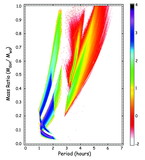
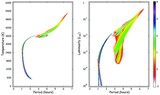
Secondary (donor) mass, M2 as a function of orbital period. The solid curve is based on the assumption that the donor star fills its Roche lobe and has a radius‐mass relation appropriate to stars on the main sequence (i.e., eq. [2]) The main‐sequence models were generated with the same bipolytrope code that was used to carry out the binary stellar evolution calculations and are discussed in the text. The dashed curves are polynomial fits to the M2‐Porb relations derived from the population synthesis study shown in Fig. 12. The labels (a)–(d) correspond to the four different panels in Fig. 12.
Other Images in This Article
Show More
Copyright and Terms & Conditions
© 2001. The American Astronomical Society. All rights reserved. Printed in U.S.A.