Image Details
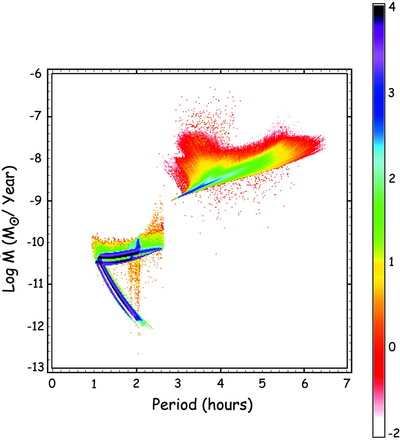
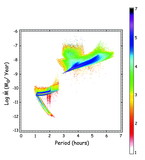
Caption: Fig. 3.
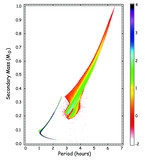
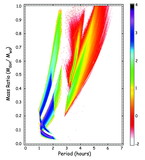
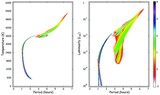
Computed population of cataclysmic variables at the current epoch in the ﹩\dot{M- }P_{\mathrm{orb}\,}﹩ plane for our standard model (see Table 1). Here ﹩\dot{M}﹩ is the mass transfer rate and Porb is the orbital period. The color represents the logarithm of the number of systems in a particular ﹩\dot{M- }P_{\mathrm{orb}\,}﹩ cell, of which there are 100 per hour interval in Porb and 100 per decade in ﹩\dot{M}﹩. The color scale is given on the right‐hand side of the figure. We note that the scattered, isolated (red) points in the image below the main tracks are minor numerical artifacts of the evolution code that occasionally appear when the Roche lobe makes initial contact with the atmosphere of the donor star. One of these dots corresponds to only ~0.1 CVs in the entire Galaxy at the current epoch, and so is of no significance.
Other Images in This Article
Show More
Copyright and Terms & Conditions
© 2001. The American Astronomical Society. All rights reserved. Printed in U.S.A.