Image Details
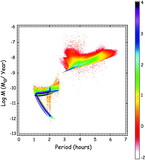
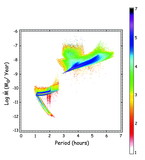
Caption: Fig. 9.
Computed orbital period distributions for cataclysmic variables at the current epoch. Left panel: the solid curve is the distribution for all systems that appear in Fig. 3; the dashed curve was produced by scaling the contributions of each system evolved by ﹩\dot{M}^{3/ 2}﹩, while the dotted curve is for an ﹩\dot{M}^{1}﹩ scaling (see text). The ﹩\dot{M}^{3/ 2}﹩‐ and ﹩\dot{M}^{1}﹩‐scaled curves have been shifted vertically by arbitrary amounts for ease in comparison. Right panel: the solid curve is for all systems in Fig. 3 that have not yet reached orbital period minimum; the dashed curve is for systems that have evolved past the orbital period minimum.
Other Images in This Article
Show More
Copyright and Terms & Conditions
© 2001. The American Astronomical Society. All rights reserved. Printed in U.S.A.