Image Details
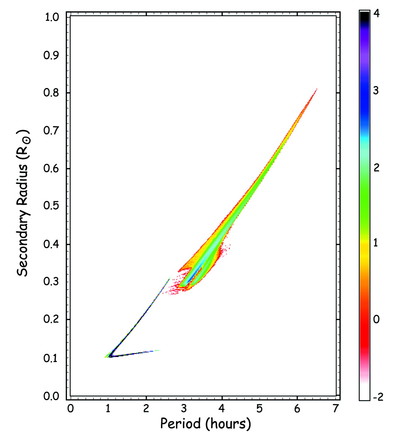
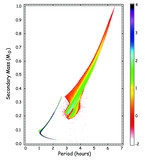
Caption: Fig. 4.
Computed population of cataclysmic variables at the current epoch in the ﹩R_{2}- P_{\mathrm{orb}\,}﹩ plane for our standard model (see Table 1). Here R2 is the radius of the donor star. The color represents the logarithm of the number of systems in a particular R2‐Porb cell, of which there are 100 per 0.1 R⊙ and 100 per hour interval in Porb. The color scale is given on the right‐hand side of the figure.
Other Images in This Article
Show More
Copyright and Terms & Conditions
© 2001. The American Astronomical Society. All rights reserved. Printed in U.S.A.
Copyright ©
2025 Astronomy Image Explorer. All Rights Reserved.