Image Details
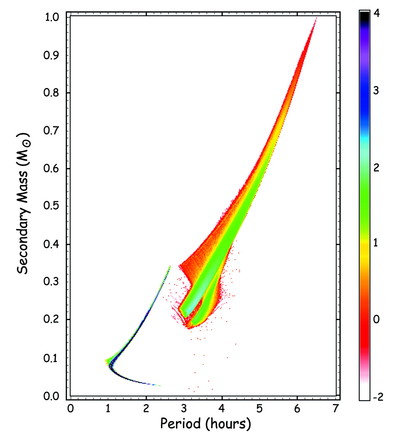
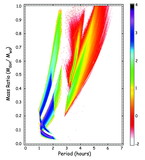
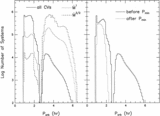
Caption: Fig. 5.
Computed population of cataclysmic variables at the current epoch in the M2‐Porb plane for our standard model (see Table 1). Here M2 is the mass of the donor star. The color represents the logarithm of the number of systems in a particular M2‐Porb cell, of which there are 100 per 0.1 M⊙ and 100 hr−1 interval in Porb. The color scale is given on the right‐hand side of the figure.
Other Images in This Article
Show More
Copyright and Terms & Conditions
© 2001. The American Astronomical Society. All rights reserved. Printed in U.S.A.
Copyright ©
2025 Astronomy Image Explorer. All Rights Reserved.