Image Details
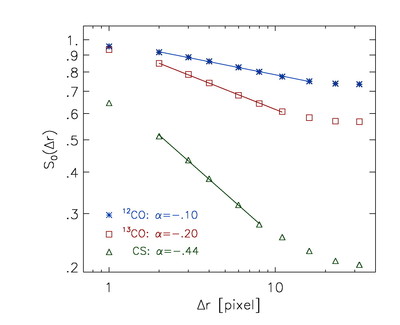
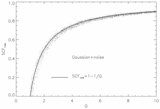
Caption: Fig. 9.
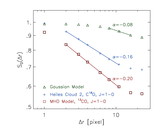
﹩S_{0}( \Delta r) ﹩ of spectral maps of different molecular transitions, computed only for spectra with ﹩Q> 2﹩. The plot is computed using maps of ﹩90\times 90﹩ synthetic ﹩^{12}﹩CO, ﹩^{13}﹩CO, and CS spectra, from Padoan et al. (1999). The same three‐dimensional cloud model, from numerical simulations of supersonic MHD turbulence, has been used in all three cases. The value of the spectral slope is larger for molecular transitions which trace a higher gas density than for transitions tracing a lower density.
Other Images in This Article
Show More
Copyright and Terms & Conditions
© 2001. The American Astronomical Society. All rights reserved. Printed in U.S.A.
Copyright ©
2025 Astronomy Image Explorer. All Rights Reserved.