Image Details
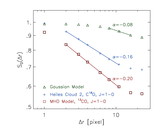
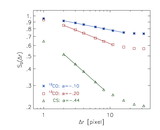
Caption: Fig. 3.
S/N, as defined in this work, plotted against the usual definition of S/N, based on Gaussian fits to the spectra. The spectra from the Heiles cloud 2 map are used. Each panel shows the scatter plot for a different value of the width of the velocity window, W. The parameter σ is the standard deviation of the spectrum averaged over the whole map. The value used to compute the SCF in this work is ﹩W=10\,\sigma ﹩.
Other Images in This Article
Show More
Copyright and Terms & Conditions
© 2001. The American Astronomical Society. All rights reserved. Printed in U.S.A.
Copyright ©
2025 Astronomy Image Explorer. All Rights Reserved.