Image Details
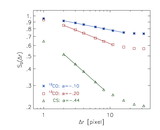
Caption: Fig. 6.
Average values of the normalized SCF, using only pixels with ﹩Q> 2﹩, as a function of Q averaged over the whole map. The value of ﹩\langle Q\rangle ﹩ is varied by adding different levels of noise to the synthetic spectra. The plot is computed using a map of ﹩90\times 90﹩ synthetic ﹩^{13}﹩CO spectra, from Padoan et al. (1999).
Other Images in This Article
Show More
Copyright and Terms & Conditions
© 2001. The American Astronomical Society. All rights reserved. Printed in U.S.A.
Copyright ©
2025 Astronomy Image Explorer. All Rights Reserved.