Image Details
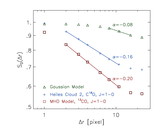
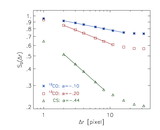
Caption: Fig. 2.
Left panel: SCF vs. rms antenna temperature, for a smooth map of noiseless Gaussian spectra (solid line), and for noiseless synthetic spectra, computed using the results of MHD turbulence simulations (scatter plot). Both the decrease of the values of the SCF and the increase in its dispersion occur even without noise, and are just the effect of structure in the map (cloud structure) and in the velocity profile of individual spectra. The map of Gaussian spectra has a linear intensity gradient along one axis, such that the total intensity varies by a factor of 2 over the whole map. Central and right panels: Same as left panel, but with uniform Gaussian noise added to the spectra. The SCF is now plotted against Q. The values of the SCF of the two models are still different after noise has been added, which confirms that the SCF vs. the S/N can be used as a tool to describe spectral line data cubes, even if the gross shape of the scatter plots is mostly due to the effect of noise.
Other Images in This Article
Show More
Copyright and Terms & Conditions
© 2001. The American Astronomical Society. All rights reserved. Printed in U.S.A.