Image Details
Caption: Fig. 6.
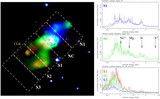
(a) Normalized azimuthal surface brightness profiles of the southern outflow cone, in Hα emission (diamonds, dashed line) and 0.3–2.0 keV X‐ray emission (crosses, dotted line). (b) Hα profile with best‐fit hollow cone model (Ic/Is = 0) overlaid (solid line). A model with Ic/Is = 0. 2 (dashed line) overpredicts the central surface brightness between position angles 134° and 142°. (c) Same as (b), but for the soft X‐ray emission. Models with Ic/Is ≥ 0.3 (dashed line) fail to fit the data between position angles 134° and 142°.
Other Images in This Article
Copyright and Terms & Conditions
© 2000. The American Astronomical Society. All rights reserved. Printed in U.S.A.
Copyright ©
2025 Astronomy Image Explorer. All Rights Reserved.