Image Details
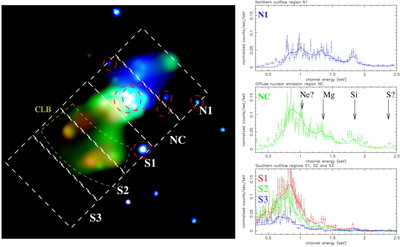
Caption: Fig. 3.
Three‐color, logarithmically scaled, soft X‐ray image of the central 2﹩\arcmin﹩ × 2﹩\arcmin﹩ (~1.5 × 1.5 kpc) region, showing the spectral variation along the outflow lobes. Emission in the range 0.3 keV ≤ E < 0.6 keV is shown in red, emission in the range 0.6 keV ≤ E < 1.1 keV in green, and emission in the range 1.1 keV ≤ E < 2.0 keV in blue. The southeastern outflow cone, on the near side of the disk, becomes progressively "soft" as it rises above the absorbing H I gas in the disk and starburst region of GC 253. In contrast, only the highest‐energy X‐ray photons from the northwestern lobe of the outflow make it through the disk without absorption. The white dashed boxes show regions from which spectra of the diffuse emission, shown in the panels on the right, were extracted. The yellow dashed line outlines the region most clearly limb‐brightened in both X‐ray and Hα images. Dashed red circles show regions of emission from point sources that were excluded in extracting the diffuse spectra. The spectra of the nuclear region and the northern outflow clearly show significant absorption at photon energies E < 1 keV.
Other Images in This Article
Copyright and Terms & Conditions
© 2000. The American Astronomical Society. All rights reserved. Printed in U.S.A.