Image Details
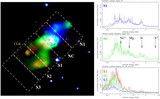
Caption: Fig. 1.
(a) Chandra ACIS S3 soft X‐ray (0.3–2.0 keV) image of the center of NGC 253. Tick marks correspond to 30﹩\arcsec﹩. The image, shown on a square root–intensity scale, has been adaptively smoothed and background subtracted. Contour levels shown in black start at 2.9 × 10⁻⁵ counts s−1 arcsec−2 and increase in steps of 3.2 × 10⁻⁵ counts s−1 arcsec−2. White contours highlight the complex high surface brightness emission within the starburst region itself at levels of (4.8, 6.5, 13.0, and 26.0) × 10−4 counts s−1 arcsec−2. (b) Hard X‐ray image (2.0–8.0 keV energy band) of the same region as in (a), again adaptively smoothed and shown using a square root–intensity scale. Contour levels have been chosen to highlight the clear lack of hard X‐ray emission along the outflow lobes seen in (a). The black contour levels start at 0.7 × 10⁻⁵ counts s−1 arcsec−2, a factor of 4 lower than the minimum used in (a), and increase in multiples of 2 in surface brightness up to the minimum surface brightness level used in the contours of (a). In both panels, the dashed and dotted lines show the position of the major and minor axes, respectively, of the galaxy, which intersect at the position of the brightest radio source (α = 00h47m33﹩\fs﹩14, δ = −25°17﹩\arcmin﹩17﹩\farcs﹩2 [J2000.0]), which is presumed to be the nucleus (Ulvestad & Antonucci 1997).
Other Images in This Article
Copyright and Terms & Conditions
© 2000. The American Astronomical Society. All rights reserved. Printed in U.S.A.