Image Details
Caption: Fig. 2.
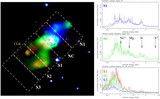
Logarithmically scaled continuum‐subtracted Hα image of the same region of NGC 253 as shown in Fig. 1. The 0.3–2.0 keV X‐ray emission is shown as white contours. There is a clear similarity between the soft X‐ray and Hα emission, in particular the southern outflow cone is strongly limb‐brightened in both soft X‐ray and Hα emission.
Other Images in This Article
Copyright and Terms & Conditions
© 2000. The American Astronomical Society. All rights reserved. Printed in U.S.A.
Copyright ©
2025 Astronomy Image Explorer. All Rights Reserved.