Image Details
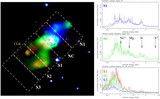
Caption: Fig. 5.
(a) Spatial model assumed for the origin of the X‐ray and Hα emission. (b) Chandra 0.3–2.0 keV image, showing the region of clear limb brightening between Rmin and Rmax, used in extracting the azimuthal surface brightness profile (curved dashed lines). This region lies between 27﹩\arcsec﹩ and 47﹩\arcsec﹩ (~340 and 590 pc) from the major axis of NGC 253. These lines, along with the straight dashed lines parallel to the outflow, delimit the spatial region used to calculate gas masses, densities, and filling factors, as described in § 5. (c) Same as (b), but showing the same region on the Hα image.
Other Images in This Article
Copyright and Terms & Conditions
© 2000. The American Astronomical Society. All rights reserved. Printed in U.S.A.