

Image Details
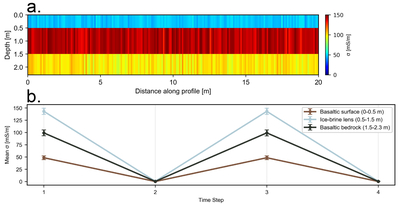
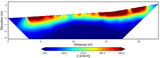
Caption: Figure 9.
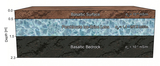
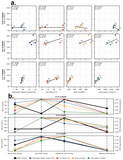
Time-lapse inversion results for the Martian forward-modeling framework (Figure 8). (a) Inverted cross section displaying the σ field along the 20 m synthetic profile at time step 1, when the lens σel is 297.8 mS m−1. The three layers are the basaltic surface (0–0.5 m), the perchlorate ice–brine lens (0.5–1.5 m), and the basaltic bedrock (1.5–2.3 m). The vertical striping reflects the 5% random noise added to the synthetic data. (b) Inverted data represented by mean σ across the three layers over the four 30 sol time steps, with the lens alternating between 297.8 mS m−1 (time steps 1 and 3) and 1.4 mS m−1 (time steps 2 and 4). The legend identifies each layer as in the model cartoon (Figure 8). The simulation utilizes the identical coil configuration, instrument specifications, and inversion parameters employed in the Zodletone Spring surveys. Error bars across data points denote the spatial standard deviation across the simulated survey grid.
Other Images in This Article
Copyright and Terms & Conditions
© 2026. The Author(s). Published by the American Astronomical Society.

