

Image Details
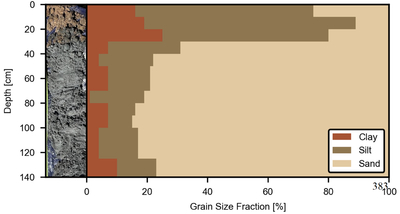
Caption: Figure 3.
Soil profile and grain-size distribution from the spring-monitoring well (Figure 1). Left: photograph of the 0–1.4 m core, showing the oxidized, salt-bearing clay (0–0.3 m), the mottled redox-transition interval (roughly 0.3–0.4 m), and the underlying dark, reduced euxinic sands. Right: clay, silt, and sand fractions for each sampled depth interval.
Other Images in This Article
Copyright and Terms & Conditions
© 2026. The Author(s). Published by the American Astronomical Society.

Copyright ©
2026 Astronomy Image Explorer. All Rights Reserved.
