

Image Details
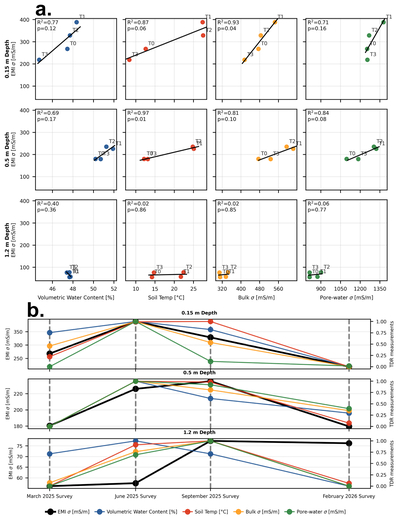
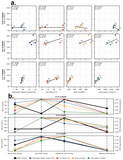
Caption: Figure 7.
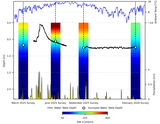
Relationship between calibrated EMI σ values and various TDR measurements at 0.15, 0.5, and 1.2 m depth. (a) Scatter plots of EMI σ versus TDR measurements. T0–T3 markers represent the four EMI surveys: T0, 2025 March (spring); T1, 2025 June (summer); T2, 2025 September (fall); and T3, 2026 February (winter). Black lines are ordinary least-squares linear fits; R2- and p-values are calculated from four surveys and are exploratory. (b) Temporal relationships are displayed as a function of depth, with EMI σ (black, left axis) and TDR measurements scaled between 0 and 1 (colored, right axis) to represent the relative strength of relationships.
Other Images in This Article
Copyright and Terms & Conditions
© 2026. The Author(s). Published by the American Astronomical Society.

