

Image Details
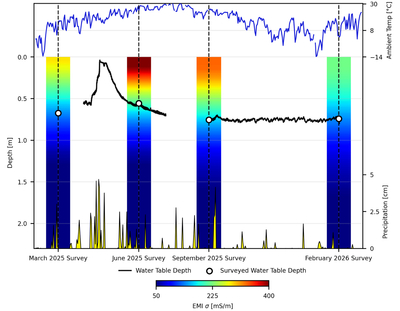
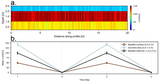
Caption: Figure 6.
Modified Hovmöller diagram displaying EMI-derived σ distributions as a function of depth and time. The colored columns show the mean calibrated EMI σ, calculated in 1 cm depth bands from 0 to 2.3 m, for each survey (dashed vertical lines). The black line shows the water-table depth recorded at 15 minute intervals by the groundwater logger in the spring-monitoring well (Figure 1) and is superimposed on the primary depth y-axis; gaps indicate sensor outages. The secondary y-axes illustrate temporal variations in ambient air temperature (blue line) and precipitation (yellow) obtained from the Fort Cobb and Apache stations of the Oklahoma Mesonet (F. V. Brock et al. 1995; R. A. McPherson et al. 2007). The surveyed water-table depths (open circles) display the exact depth at each survey, with the 2025 March point being an extrapolated depth derived from the nearest depth trends and constrained by referencing regional rainfall data.
Other Images in This Article
Copyright and Terms & Conditions
© 2026. The Author(s). Published by the American Astronomical Society.

