

Image Details
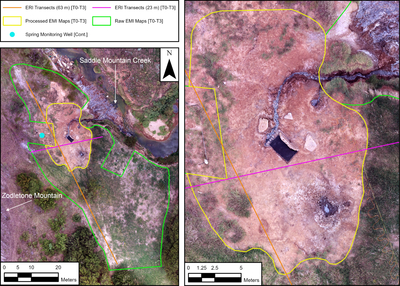
Caption: Figure 1.
Aerial photograph of the study site. Left: geophysical surveys at the study site, including the 63 m ERI calibration transect (orange) and 23 m ERI validation transect (magenta), the raw EMI footprint (green) and processed EMI domain (yellow), and the spring-monitoring well used in ground-truth analysis (cyan). The bracketed labels [T0–T3] denote features surveyed during all four campaigns, and [Cont.] denotes continuous monitoring. Right: inset of the spring site highlighting the processed EMI domain used in time-lapse inversion.
Other Images in This Article
Copyright and Terms & Conditions
© 2026. The Author(s). Published by the American Astronomical Society.

Copyright ©
2026 Astronomy Image Explorer. All Rights Reserved.
