

Image Details
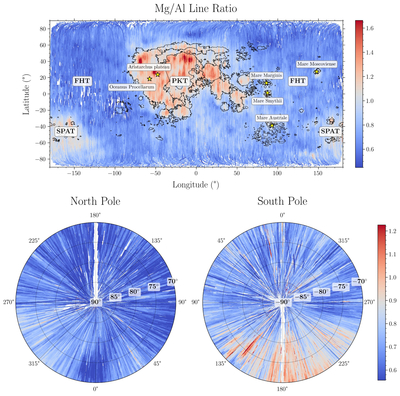
Caption: Figure 9.
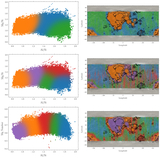
Lunar Mg/Al X-ray intensity maps. Top panel: cylindrical projection. Black lines are mare boundaries from LROC data. We see a clear distinction in the Mg/Al ratio between the mare and highlands. Bottom panels: maps of the polar regions. The numbers around the periphery are longitudes, while the bold numbers denote latitudes.
Other Images in This Article
Copyright and Terms & Conditions
© 2026. The Author(s). Published by the American Astronomical Society.

Copyright ©
2026 Astronomy Image Explorer. All Rights Reserved.
