

Image Details
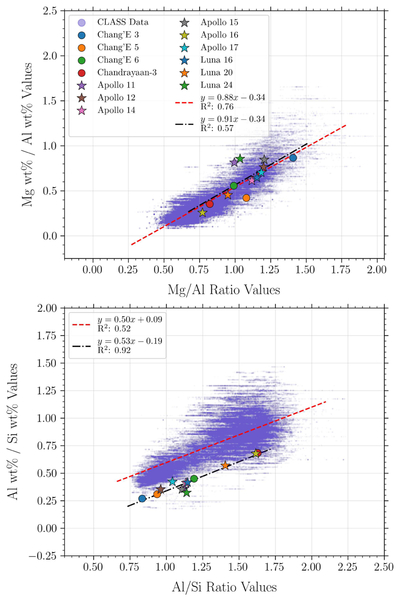
Caption: Figure 6.
Comparing XRF line-intensity ratios (this work) with elemental abundance data. Purple points denote inferred elemental weight ratios from S. Narendranath et al. (2024). The star and circle symbols denote actual measurements from various missions. We see a positive linear correlation in the measurements. The dashed lines denote linear regression 1D polynomial fits. The red dashed lines denote the fit to CLASS data, while the black dashed–dotted line denotes the fit to elemental weight ratio data from various missions.
Other Images in This Article
Copyright and Terms & Conditions
© 2026. The Author(s). Published by the American Astronomical Society.

Copyright ©
2026 Astronomy Image Explorer. All Rights Reserved.
