

Image Details
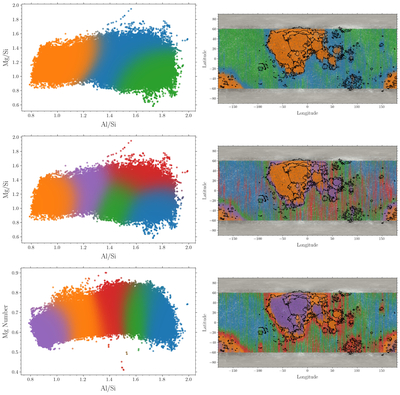
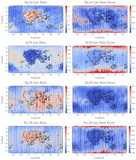
Caption: Figure 8.
Lunar geochemical classification using Gaussian mixture models (GMMs) on CLASS XRF line-intensity ratios. In all maps, black contours represent mare boundaries from LROC data. Left panels show the 2D density distributions and GMM cluster assignments; right panels show the corresponding spatial distribution on a global Mercator projection. Top row: three-component GMM applied to ﹩{{ \mathcal R }}_{{\rm{Si}}\,}^{\,{\rm{Al}}}﹩ versus ﹩{{ \mathcal R }}_{{\rm{Si}}\,}^{\,{\rm{Mg}}}﹩ identifying the primary dichotomy between the basaltic maria (orange), and the feldspathic highlands (green), along with some transitional regions (blue) outlining the maria and the South Pole–Aitken Basin. Middle row: five-component GMM of ﹩{{ \mathcal R }}_{{\rm{Si}}\,}^{\,{\rm{Al}}}﹩ versus ﹩{{ \mathcal R }}_{{\rm{Si}}\,}^{\,{\rm{Mg}}}﹩, further resolving geochemical subunits and mixing zones. Bottom row: five-component GMM applied to the distribution of the Mg# proxy derived from ﹩({{ \mathcal R }}_{{\rm{Si}}\,}^{\,{\rm{Mg}}}/[{{ \mathcal R }}_{{\rm{Si}}\,}^{\,{\rm{Mg}}}+{{ \mathcal R }}_{{\rm{Si}}\,}^{\,{\rm{Fe}}}])﹩ versus Al/Si, grouping Mare Moscoviense, Mare Australe, Mare Marginis, and Mare Smythii separately from the larger nearside basins.
Other Images in This Article
Copyright and Terms & Conditions
© 2026. The Author(s). Published by the American Astronomical Society.

