

Image Details
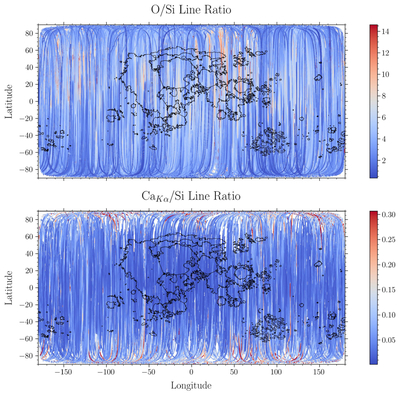
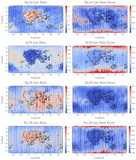
Caption: Figure 5.
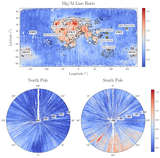
Lunar XRF line-intensity ratio maps of O/Si and Ca-Kα/Si from CLASS data binned at 296 s. Black lines are mare boundaries from LROC data. Oxygen is not expected to vary much across the lunar surface, which is indeed observed in the O/Si map. On the other hand, the expected differences in terranes are not observed in the Ca-Kα/Si map.
Other Images in This Article
Copyright and Terms & Conditions
© 2026. The Author(s). Published by the American Astronomical Society.

Copyright ©
2026 Astronomy Image Explorer. All Rights Reserved.
