

Image Details
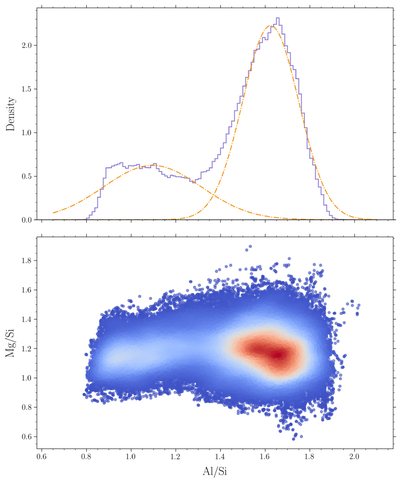
Caption: Figure 7.
Top panel: a histogram of Al/Si line ratios (purple) measured over the entire surface shows a clear bimodal distribution, corresponding to the mare and highland terranes. The Gaussian fits to this distribution are shown by the dashed–dotted orange line. Bottom panel: a two-dimensional distribution of the Mg/Si and Al/Si line ratios also shows a multimodal distribution. The color map shows the density of data points in the 2D space, going from low (blue) to high (red) density.
Other Images in This Article
Copyright and Terms & Conditions
© 2026. The Author(s). Published by the American Astronomical Society.

Copyright ©
2026 Astronomy Image Explorer. All Rights Reserved.
