

Image Details
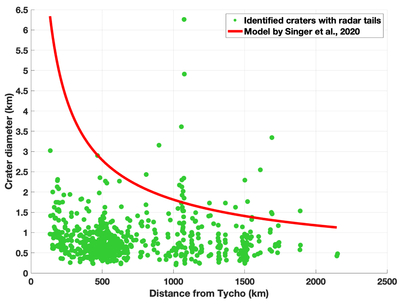
Caption: Figure 7.
Secondary crater diameter as a function of distance from Tycho. The solid red line represents the likely maximum secondary crater diameter (see Table 2 from K. N. Singer et al. 2020) at a given distance from the primary crater. Green points show observed craters. Note that the model line is a 99th percentile regression, and as such, measured craters should mostly fall below this line.
Other Images in This Article
Show More
Copyright and Terms & Conditions
© 2026. The Author(s). Published by the American Astronomical Society.

Copyright ©
2026 Astronomy Image Explorer. All Rights Reserved.
