

Image Details
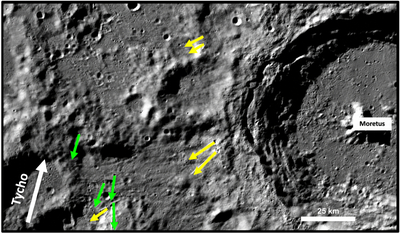
Caption: Figure 4.
Example of line direction of radar tails. This portion of the South Polar ray (70.635°N, 5.947°E) has a range of line directions calculated to be from 167﹩\mathop{.}\limits^{{\unicode{x000b0}}}﹩9 to 198﹩\mathop{.}\limits^{{\unicode{x000b0}}}﹩5. Green arrows indicate radar tails within this range, and yellow arrows represent radar tails with azimuth values outside of this range. For consistency and assumption of origin, we consider only the features within this range to be Tycho-related. The white arrow represents the orientation toward Tycho.
Other Images in This Article
Show More
Copyright and Terms & Conditions
© 2026. The Author(s). Published by the American Astronomical Society.

Copyright ©
2026 Astronomy Image Explorer. All Rights Reserved.
