

Image Details
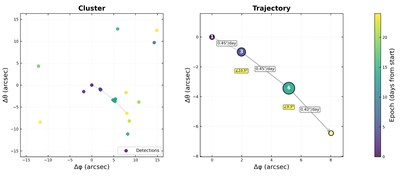
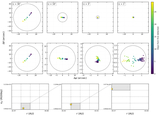
Caption: Figure 5.
Example of trajectory identification. Left: cluster of detections after projection to a common reference epoch under a trial orbit, shown in (Δϕ, Δθ) relative to the cluster center. Point color indicates epoch relative to the first detection. The detections that make up the trajectory are connected with gray line segments. Right: the trajectory recovered from the clustered detections. Point size indicates the number of individual internight detections contained within that metapoint. The retained detections form a coherent, time-ordered path with an approximately consistent drift rate and direction, while unrelated cluster members are rejected.
Other Images in This Article
Show More
Copyright and Terms & Conditions
© 2026. The Author(s). Published by the American Astronomical Society.

