

Image Details
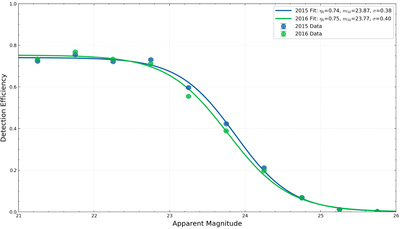
Caption: Figure 8.
Catalog detection efficiency as a function of apparent magnitude, derived from implanted fake objects in the data. Fakes are assigned neutral colors (g − r = r − i = i − z = 0), such that the detection efficiency is treated as magnitude-dependent only. Each data point represents the recovery fraction of implanted fakes in a given magnitude bin. Curves show maximum-likelihood fits to the logistic function in Equation (5), where η0 is the plateau efficiency, m50 is the 50% completeness magnitude, and σ controls the transition width. Fits are performed independently for each observing season, yielding η0 = 0.74, m50 = 23.87, σ = 0.38 for 2015 and η0 = 0.75, m50 = 23.77, σ = 0.40 for 2016. These fitted parameters are used in the nondetection test to evaluate whether candidate links have plausible detection rates given their apparent brightness and survey coverage.
Other Images in This Article
Show More
Copyright and Terms & Conditions
© 2026. The Author(s). Published by the American Astronomical Society.

