

Image Details
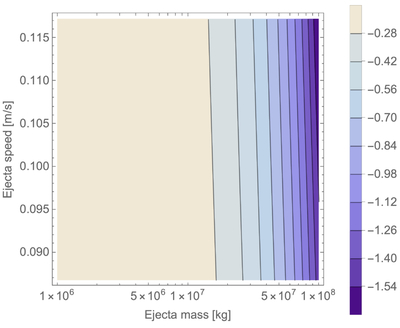
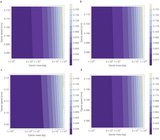
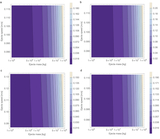
Caption: Figure 6.
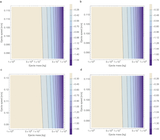
Mutual orbit period change in seconds due to Didymos’s shape change process that includes both DART-ejecta accumulation and spin-driven shape change. The plot format is identical to that for Figure 4, where the horizontal axis is the ejecta mass in kg, while the vertical axis is the average initial ejecta speed in m s−1. The color bar offers the resulting orbital period change in s. Negative values mean mutual orbit period drops.
Other Images in This Article
Copyright and Terms & Conditions
© 2026. The Author(s). Published by the American Astronomical Society.

Copyright ©
2026 Astronomy Image Explorer. All Rights Reserved.
