

Image Details
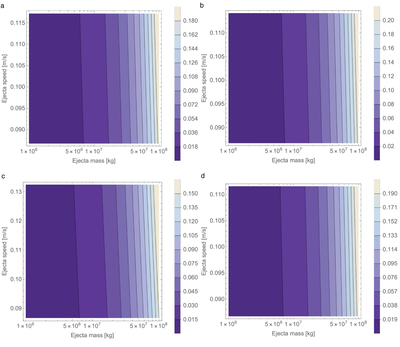
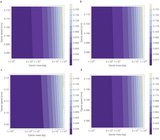
Caption: Figure A2.
Net thickness change at the equator including both Modifications I and II for all the shape cases. Each panel shows a different shape. Panel (a) shows the case when a0 = 413 m, b0 = 395.5 m, and c0 = 298 m. Panel (b) illustrates the case when a0 = 393 m, b0 = 375.5 m, and c0 = 318 m. Panel (c) shows the case when a0 = 433 m, b0 = 415.5 m, and c0 = 318 m. Finally, Panel (d) illustrates the case when a0 = 413 m, b0 = 395.5 m, and c0 = 278 m. Panel (a) is identical to Figure 5.
Other Images in This Article
Copyright and Terms & Conditions
© 2026. The Author(s). Published by the American Astronomical Society.

Copyright ©
2026 Astronomy Image Explorer. All Rights Reserved.
