

Image Details
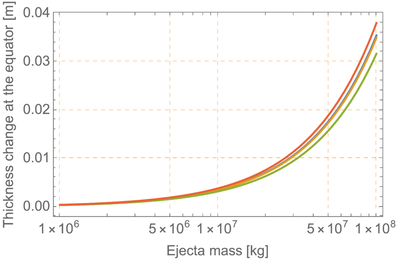
Caption: Figure 2.
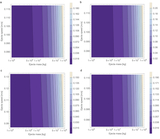
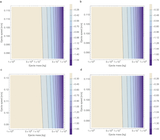
Thickness change at the equator after ejecta accumulation on Didymos (Modification I), i.e., Δte = (χ − 1)(a0 + b0)/2. The plot shows four different pre-impact shapes. The blue line shows the case when a0 = 413 m, b0 = 395.5 m, and c0 = 298 m. The yellow line illustrates the case when a0 = 393 m, b0 = 375.5 m, and c0 = 318 m. The green line shows the case when a0 = 433 m, b0 = 415.5 m, and c0 = 318 m. Finally, the red line shows the case when a0 = 413 m, b0 = 395.5 m, and c0 = 278 m.
Other Images in This Article
Copyright and Terms & Conditions
© 2026. The Author(s). Published by the American Astronomical Society.

Copyright ©
2026 Astronomy Image Explorer. All Rights Reserved.
