

Image Details
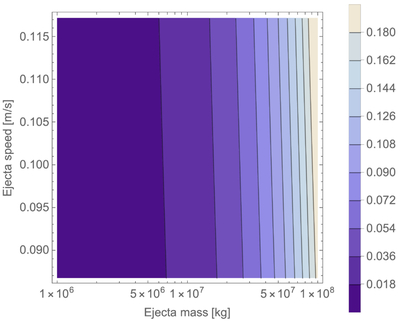
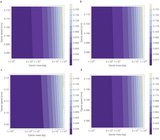
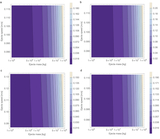
Caption: Figure 5.
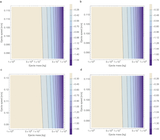
Net thickness change at the equator including both Modifications I and II. The contour plot shows Δtt in meters as a function of ejecta mass and speed. Positive values indicate that the axis on the equatorial plane grows owing to the described reshaping process.
Other Images in This Article
Copyright and Terms & Conditions
© 2026. The Author(s). Published by the American Astronomical Society.

Copyright ©
2026 Astronomy Image Explorer. All Rights Reserved.
