

Image Details
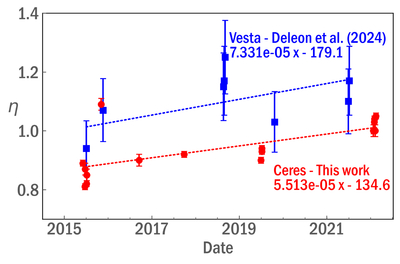
Caption: Figure 5.
Measured η over time for Ceres and Vesta observed with SOFIA FORCAST and analyzed in the same way. The Vesta data are from A. Deleon et al. (2024). Dotted lines show a linear fit to both datasets, along with the equation of the line. The slope of the two linear fits is of the same order of magnitude, suggesting the observed increase in η is due to an instrumental effect.
Other Images in This Article
Copyright and Terms & Conditions
© 2026. The Author(s). Published by the American Astronomical Society.

Copyright ©
2026 Astronomy Image Explorer. All Rights Reserved.
