

Image Details
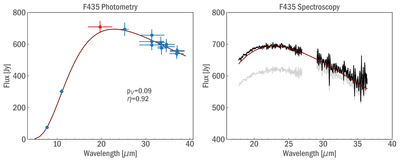
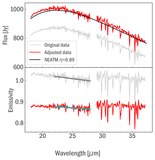
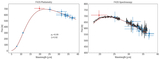
Caption: Figure 2.
(Left) NEATM fit (maroon) to the photometric points (blue) for flight F435. The red point was excluded from the fit because it is located in a spectral feature. (Right) The original flux (gray) was scaled to the NEATM model (maroon) at 26 and 30 μm. The scaled spectra are shown in black.
Other Images in This Article
Copyright and Terms & Conditions
© 2026. The Author(s). Published by the American Astronomical Society.

Copyright ©
2026 Astronomy Image Explorer. All Rights Reserved.
