

Image Details
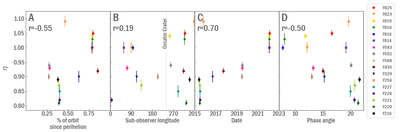
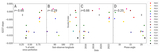
Caption: Figure 4.
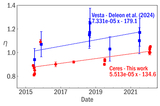
Changes in η with (A) orbital position, (B) subobserver longitude, (C) date, and (D) phase angle. Included in the figure is the correlation coefficient, r. We see a positive trend with date, but no other strong correlations.
Other Images in This Article
Copyright and Terms & Conditions
© 2026. The Author(s). Published by the American Astronomical Society.

Copyright ©
2026 Astronomy Image Explorer. All Rights Reserved.
