

Image Details
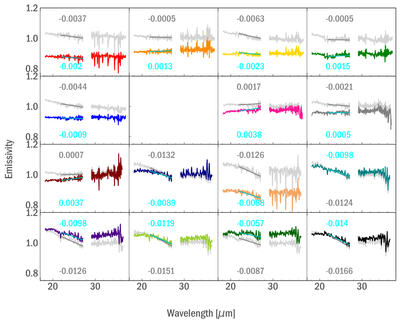
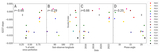
Caption: Figure A2.
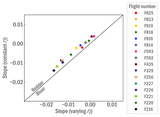
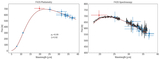
Comparison between original emissivity (gray lines, same as Figure 3) and emissivity found by scaling the flux to a SED found with constant η (colored lines). The calculated slope is visualized with a gray and cyan line, respectively, and the slope values are printed in corresponding colors. The shape of the spectra is the same, but the overall emissivity and relative slope differ. A comparison between the two methods is visualized in Figure 8.
Other Images in This Article
Copyright and Terms & Conditions
© 2026. The Author(s). Published by the American Astronomical Society.

Copyright ©
2026 Astronomy Image Explorer. All Rights Reserved.
