

Image Details
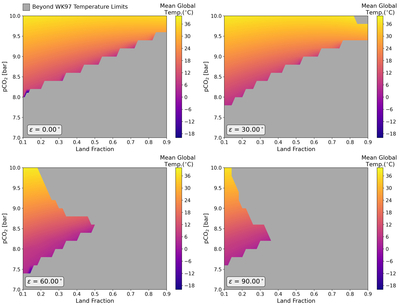
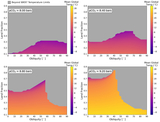
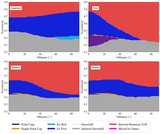
Caption: Figure 7.
Annual mean global surface temperature for different configurations of pCO2 and land fraction at four different ε values for Set D. Simulations where the temperature exceeded the boundaries of the WK97 model are shown in dark gray.
Other Images in This Article
Copyright and Terms & Conditions
© 2026. The Author(s). Published by the American Astronomical Society.

Copyright ©
2026 Astronomy Image Explorer. All Rights Reserved.
