

Image Details
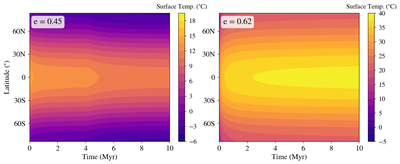
Caption: Figure 5.
Set B latitudinal annual temperature variation of Gl 514 b after 10 Myr evolution for two different orbital configurations. The nearly horizontal contours after ∼5 Myr indicate the model prediction has stabilized. Left panel: surface temperature (in °C) for e = 0.45. Right panel: e = 0.62. Note that the color bar for the right panel is not the same due to the large difference in surface temperature between each simulation.
Other Images in This Article
Copyright and Terms & Conditions
© 2026. The Author(s). Published by the American Astronomical Society.

Copyright ©
2026 Astronomy Image Explorer. All Rights Reserved.
