

Image Details
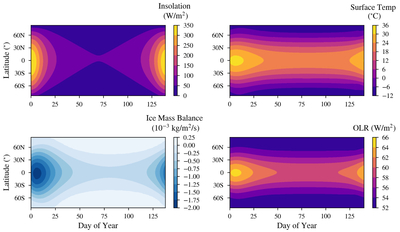
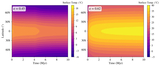
Caption: Figure 3.
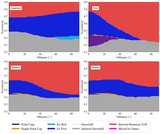
An individual simulation from Set A showing the annual latitudinal climate of Gl 514 b (ε = 3﹩\mathop{.}\limits^{{\unicode{x000b0}}}﹩0, ψ = 90°, and pCO2 = 8.375 bar). Top left: insolation received by the planet. Top right: surface temperature. Bottom left: ice mass balance. A positive value represents ice accumulation while a negative value represents ice melting. Bottom right: outgoing longwave radiation.
Other Images in This Article
Copyright and Terms & Conditions
© 2026. The Author(s). Published by the American Astronomical Society.

Copyright ©
2026 Astronomy Image Explorer. All Rights Reserved.
