

Image Details
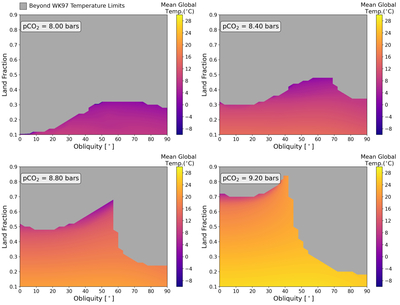
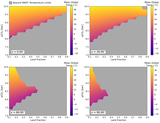
Caption: Figure 8.
Annual mean global surface temperature for different configurations of land fraction and obliquity at four different pCO2 values for Set D. Simulations where the surface temperature exceeds the WK97 boundaries are shown in dark gray.
Other Images in This Article
Copyright and Terms & Conditions
© 2026. The Author(s). Published by the American Astronomical Society.

Copyright ©
2026 Astronomy Image Explorer. All Rights Reserved.
