

Image Details
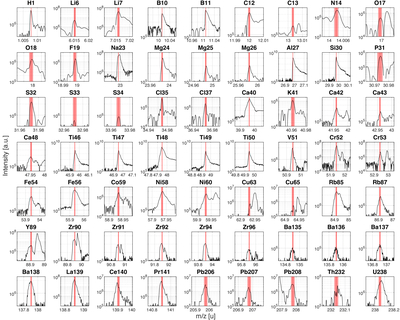
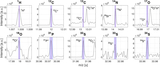
Caption: Figure E1.
Detected isotopes in the upper (younger) part of the studied JC sample using LMS-GT. The red vertical line indicates the expected isotope mass indicated in the title of each panel. The transparent red areas correspond to a range of ±30 ppm around the expected isotope mass.
Other Images in This Article
Show More
Copyright and Terms & Conditions
© 2026. The Author(s). Published by the American Astronomical Society.

Copyright ©
2026 Astronomy Image Explorer. All Rights Reserved.
