

Image Details
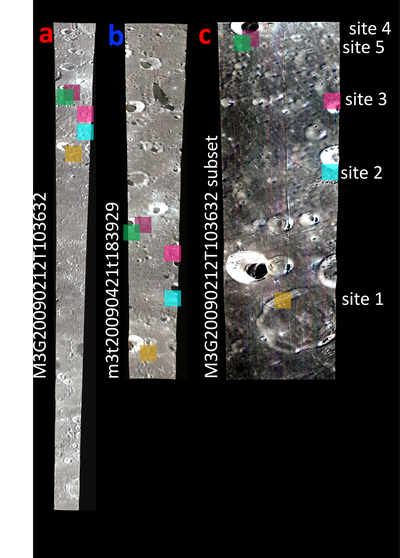
Caption: Figure 2.
Map-projected example images of M3 targeted and global data used in this study. Figure letter colors correspond to image strip colors in Figure 1. (a) M3 global data of the study region, optical period 1b (morning), image M3G20090212T103632 (140 m pixel−1). (b) M3 targeted data of the lunar highlands study region, optical period 2a (afternoon), image m3t20090421t183929 (70 m pixel−1). (c) Subset (100 m pixel−1) of the M3 image in (a). Five study region sites from which spectra were acquired are labeled in (c). Box colors correspond to Figure 4 colors. North is up in all images. Crater diameters are as follows: site 1: Bunsen A (∼41 km), site 2: Gerard B (∼14 km), site 3: Galvani D (∼9 km), site 4 and site 5: McLaughlin D (∼11 km).
Other Images in This Article
Show More
Copyright and Terms & Conditions
© 2026. The Author(s). Published by the American Astronomical Society.

