

Image Details
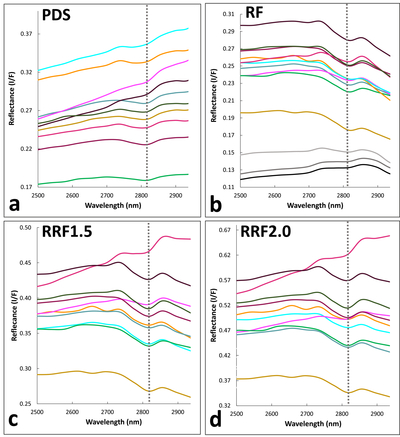
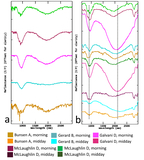
Caption: Figure 8.
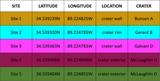
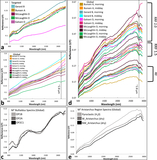
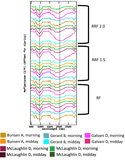
3 μm region insets of Figures 5(b) and (d) spectra. (a) PDS-correction spectra (R. N. Clark et al. 2011), (b) RF correction spectra (K. Wohlfarth et al. 2023) plotted with M3 Aristarchus region spectra (S. Li & R. E. Milliken 2016), (c) RRF1.5 correction spectra (K. Wohlfarth et al. 2023), (d) RRF2.0 correction spectra (K. Wohlfarth et al. 2023). Spectra colors correspond to legend colors in Figure 5. References in parentheses denote the thermal correction applied to each set of spectra.
Other Images in This Article
Show More
Copyright and Terms & Conditions
© 2026. The Author(s). Published by the American Astronomical Society.

Copyright ©
2026 Astronomy Image Explorer. All Rights Reserved.
