

Image Details
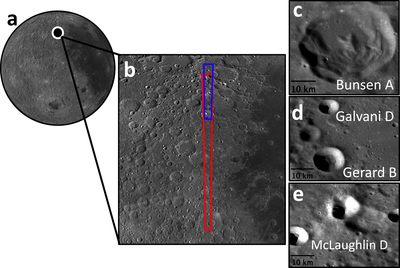
Caption: Figure 1.
(a) QuickMap Lunar globe orthographic projection with white circle denoting highlands study region location at (b). LROC WAC global 100 m pixel−1 basemap of lunar maria and highlands with red image outline denoting location of M3 global data OP 1b (morning) image M3G20090212T103632 and overlapping blue strip outline denoting location of M3 targeted data OP 2a (afternoon) image m3t20090421t183929. The blue strip is centered at ∼49.7°N, 270.9°E. The red strip is ∼50 km across. (c)–(e) LROC WAC (100 m pixel−1) and Narrow Angle Camera (0.5 m pixel−1) mosaic basemap images of lunar highland study site craters.
Other Images in This Article
Show More
Copyright and Terms & Conditions
© 2026. The Author(s). Published by the American Astronomical Society.

