

Image Details
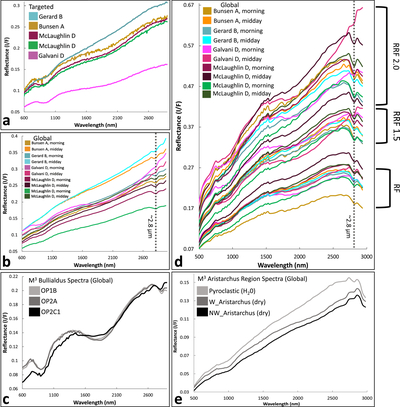
Caption: Figure 5.
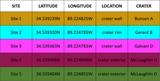
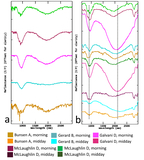
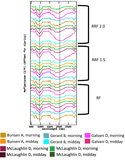
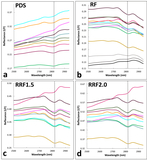
M3 global and targeted image spectra from five study sites with different thermal corrections applied, along with M3 comparison spectra for reference. (a) Spectra from PDS-corrected M3 targeted image m3t20090421t183929. (b) Spectra from PDS-corrected M3 global images M3G20090212T103632 (morning) and M3G20090712T175144 (midday) showing a time-of-day comparison. The dashed line is at ∼2.8 μm. (c) M3 spectra from the Bullialdus crater central peak exhibiting pyroxene mineral signatures with interpreted OH− absorptions by R. Klima et al. (2013). (d) M3 spectra acquired from M3G20090212T103632 (morning) and M3G20090712T175144 (midday) global images at five study sites showing time-of-day comparison among RF, RRF1.5, and RRF2.0 thermally corrected images. The dashed line is at ∼2.8 μm. The following spectra are scaled for image correction grouping purposes: RRF1.5 Bunsen A (morning), RRF 1.5 Galvani D (midday), RRF2.0 Bunsen A (morning). M3 Aristarchus region spectra from R. E. Milliken & S. Li (2017). The following applies to (a), (b), and (d). All spectra are ROI averages; spectra colors correspond to study site colors in Figure 2. (a)–(c) spectra were acquired from M3 images with the thermal correction of R. N. Clark et al. (2011) applied. (d) spectra were acquired from M3 images with the K. Wohlfarth et al. (2023) thermal correction applied. (e) spectra were acquired from M3 images with the S. Li & R. E. Milliken (2016) thermal correction applied.
Other Images in This Article
Show More
Copyright and Terms & Conditions
© 2026. The Author(s). Published by the American Astronomical Society.

