

Image Details
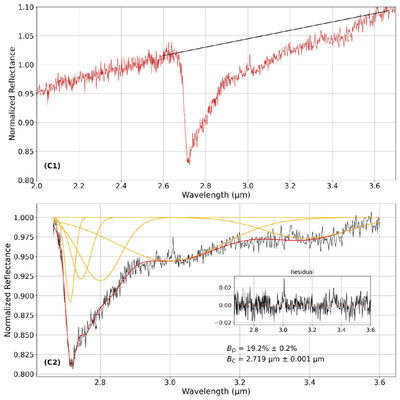
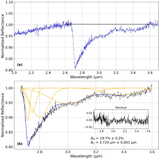
Caption: Figure A3.
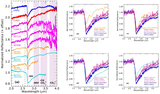
(C1) Continuum line (black solid line) calculated for the 2.7 μm band for (142) Polana’s spectrum (in red). The reflectance is then divided by the continuum line. (C2) Gaussian fits (in yellow) used to produce a multi-Gaussian-based model of the band (in red). The residual difference between the model and the data, as well as the calculated band parameters, are shown as well.
Other Images in This Article
Show More
Copyright and Terms & Conditions
© 2026. The Author(s). Published by the American Astronomical Society.

Copyright ©
2026 Astronomy Image Explorer. All Rights Reserved.
