

Image Details
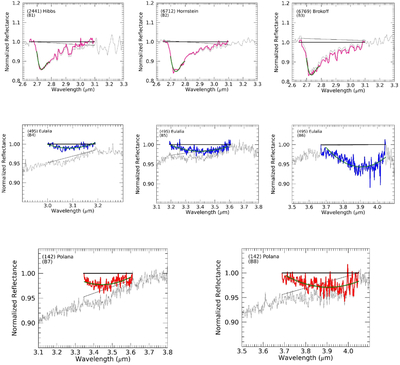
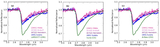
Caption: Figure A2.
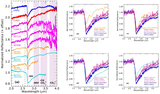
Polynomial fits for the 2.7 μm band of (B1) (2441) Hibbs, (B2) (6712) Hornstein, and (B3) (6769) Brokoff, with each spectrum normalized to 1 at 2.67 μm. (B4) The (495) Eulalia spectrum was also fit with polynomials to parameterize minor absorptions around 3.1 μm (normalized at 3.65 μm), (B5) 3.4 μm (normalized at 3.69 μm), and (B6) 3.9 μm (normalized at 4.05 μm). (B7) The (142) Polana spectrum was similarly fit with a second-order polynomial for the 3.4 μm and (B8) 3.9 μm absorptions (spectral data from A. Arredondo et al. 2025). The solid black lines represent the continuum for each band, prior (thinner line) and after (thicker line) division/isolation of the band. Polynomial fits are presented in green, overlaying either pink (for PFAs), blue (for 495 Eulalia’s bands), or red (for (142) Polana’s bands) spectra.
Other Images in This Article
Show More
Copyright and Terms & Conditions
© 2026. The Author(s). Published by the American Astronomical Society.

