

Image Details
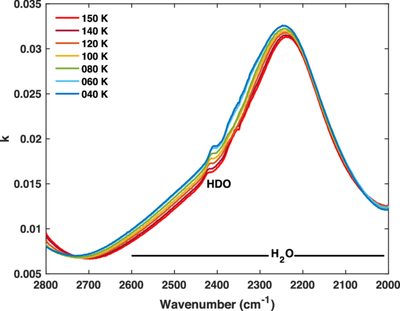
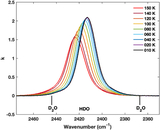
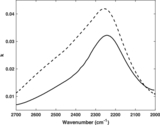
Caption: Figure 9.
The imaginary part of the optical constants for the H2O ν2 + νR band as a function of wavenumber. The band shows a slight increase in strength and a shift to higher wavenumbers as the temperature decreases. Naturally occurring HDO is visible near 2420 cm−1. It shows the same increase in strength and shift to lower wavenumbers with decreasing temperature as seen in the HDO sample in Figure 6.
Other Images in This Article
Show More
Copyright and Terms & Conditions
© 2026. The Author(s). Published by the American Astronomical Society.

Copyright ©
2026 Astronomy Image Explorer. All Rights Reserved.
